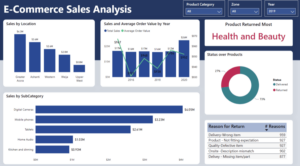
Power BI is a business intelligence platform developed by Microsoft that provides interactive data visualization and business analytics capabilities. Power BI aims to provide a unified view of organizational data to aid in data-driven decision-making. The role of Power BI is to empower organizations by transforming complex data into intuitive insights, enhancing overall operational efficiency.
Data Visualization
A major advantage of Power BI is the ability to create interactive reports and dashboards. Unlike static charts and tables in a PDF document or spreadsheet, Power BI visualizations are dynamic. Users can drill down into the data by clicking or hovering over different points on a chart. Slicers and filters give you control to focus the visuals on specific data points.

Dashboards in Power BI allow you to combine multiple visualizations into a single view for at-a-glance monitoring. You can customize dashboards with interactive features like bookmarks to save and return to specific views of the data. With compelling interactive dashboards, Power BI makes data exploration intuitive and engaging.
Overall, the visually engaging and interactive reports in Power BI empower users throughout an organization to easily extract key insights from data. Interactive data visualization transforms static data into actionable business intelligence.
Real-Time Data
The capability to connect to live data sources is a key advantage of Power BI for enhancing organizational success. Live data connections allow Power BI to provide real-time insights into business performance. Instead of static snapshots from reports, Power BI can update dashboards and reports dynamically as data changes.
Some examples of how Power BI enables real-time data analysis:
- Connect to in-memory data sources like Azure SQL Data Warehouse for immediate query results as data is loaded. This removes delays from extraction, transformation, and loading batch processes.
- Stream data directly into Power BI from IoT sensors, clickstreams, applications, and more. As devices generate event data, Power BI processes and displays the latest information.
- Use push APIs to push data to Power BI as transactions occur, like sales, support tickets, or operational events. Dashboards update automatically without waiting for extracts.
- Combine real-time with static sources for context. Show real-time metrics against historical benchmarks, trends, and forecasts.
The bottom line is that real-time data gives Power BI users up-to-the-second insights to drive faster and better-informed decisions. Organizations that leverage live data connections can react quickly with greater confidence. Power BI’s flexibility to ingest both streaming and static data in one unified view empowers organizations with real-time business intelligence capabilities.
Collaboration
Collaboration is a key benefit of Power BI that enables teams to work together more efficiently. With Power BI, reports and dashboards can be easily shared with others in your organization. Rather than emailing static reports and charts, you can provide direct access for users to interact with the latest data. It is beneficial for businesses to reach power bi consulting services to maximize their practices.
Power BI has collaboration features built-in to facilitate teamwork:
- Share reports and dashboards with a few clicks. Give access to the entire report or just specific visuals.
- Control permissions to determine who can view, interact with, or edit content.
- @mention others in report comments to loop them into conversations and notify them.
- Follow dashboards and reports to stay up-to-date on changes.
- Subscribe to automatically receive updates when reports are refreshed or changed.
- Annotate and highlight to call attention to insights.
- Discuss and ask questions right next to visuals using comments.
- Co-author content by simultaneously editing dashboards.
- Integration with Microsoft Teams and SharePoint Online to embed and share easily.
With collaborative features, teams get aligned around data. Different groups like executives, managers, analysts, and operations staff can have focused access to the reports and dashboards tailored to their needs. Power BI empowers knowledge sharing so the entire organization benefits from the latest data and insights.
Role of Power BI In Cloud-Based Business
Power BI is a cloud-based business analytics service, that is hosted in Microsoft Azure. This provides several key benefits:
- Easy to access analytics anywhere, anytime. Since Power BI is cloud-hosted, users can connect to dashboards and reports from any device with an internet connection. There is no need to install software locally.
- Automatic updates. New features and fixes are immediately rolled out to users since Power BI is centrally hosted in the cloud. There is no need to manually install updates.
- Scalability. The cloud-based architecture allows the platform to quickly scale usage up and down as needed. Capacity can be increased to support more users during high-traffic times.
- High availability. Microsoft guarantees up to 99.9% uptime for Power BI through redundancies built into the Azure infrastructure. This minimizes downtime and ensures 24/7 access.
- Streamlined deployment. Cloud-based analytics like Power BI are faster to roll out since they do not require on-premise installations. Users can get instant access from any web browser.
- Lower total cost of ownership. A cloud analytics solution like Power BI shifts infrastructure costs from capital expenditures to operating expenses. Overall costs may be lower compared to on-premise solutions.
By leveraging the scalability, accessibility, and cost structure of a cloud-based solution, Power BI makes it easier for organizations to quickly deploy analytics and enable data-driven decisions. The cloud architecture provides flexibility while removing infrastructure burdens.
Also Read:
Securing Your Business in the Cloud: Security Features of AWS and Azure
Breaking Down AWS and Azure Pricing Structures


